We've reviewed costing sheets where the math was clean, the markup looked right, and the formula still lost money at volume. The culprit wasn't the pricing model. It was the ingredient cost data feeding into it — built on volume-based spice measurements that had never been converted to gram weights. The costs were wrong before the pricing calculation ever started.
Here's the specific failure we see most often:
A blend formula calls for two teaspoons of ground cloves and three teaspoons of dried dill. Both go into the cost sheet as volume units. A price-per-ounce gets applied to each. The math produces a cost figure that looks defensible. What it doesn't account for: ground cloves weigh roughly 2.5 times more per teaspoon than dried dill. The clove cost is understated. The dill cost is overstated. The blend's true ingredient cost is different from what the sheet says — and that difference scales with every unit produced.
What this page covers:
Why yield conversion is the required first step before any cost calculation begins
How to convert volume-based blend formulas to gram weights using density-specific yield data
How to calculate true cost-per-gram for each component and apply it to a production formula
How to build pricing that accounts for yield variation, supplier changes, and production scale
If a spice blend's pricing has been built on volume-based ingredient costs, the margin it's showing is not the margin it's producing. This guide closes that gap by introducing a spice yield conversion chart that aligns ingredient measurements with true weight-based costs, starting with the measurement, not the markup
TL;DR Quick Answers
Spice Yield Conversion Chart
A spice yield conversion chart maps the gram weight of individual spices to their equivalent volume in teaspoons or tablespoons — measured separately for each spice based on its actual density.
Why it exists: A universal conversion factor of 0.5 tsp/g is wrong for roughly half the spice rack. Spice density varies 2.5x between the lightest and heaviest common spices. One number doesn't cover that range accurately.
What the data shows:
Dense spices (ground cloves, mustard seed, garlic powder): 0.35–0.45 tsp/g
Medium-density spices (paprika, cumin, chili powder): 0.45–0.55 tsp/g
Light dried herbs (dried dill, dried parsley, dried basil): 0.85–0.90 tsp/g
Who needs it:
Recipe costing — volume-based ingredient specs produce directional pricing errors
Production scaling — scaling a volume measurement multiplies the error already in it
Spice blend pricing — dense and light components carry compounding errors in both directions
Home canning — flavor consistency locked in the jar starts at the measuring spoon
Bottom line: A teaspoon tells you how much space a spice occupies. A yield chart tells you how much spice you actually have. Those are different numbers, and integrating that data into a recipe template is what helps ensure recipe consistency and food cost accuracy hold instead of falling apart.
Top Takeaways
Volume-based spice costing produces directional errors, not random ones. Dense spices are undercosted. Light spices are overcosted. Errors compound across a blend — not average out. A 40% gross margin on paper can produce 28% in production.
The 2.5x density spread makes a universal conversion unreliable. Ground cloves: 0.35 tsp/g. Dried dill: 0.90 tsp/g. One conversion factor applied to both is a structural error built into every batch and every costing calculation that follows.
Convert to gram weights before the math begins — not after. Scaling a volume measurement multiplies the error already in it. The fix:
Convert each blend component to a density-specific gram weight
Apply your scaling factor to gram weights only
Never scale from volume
Supplier changes reset your baseline. Same spice, different source — different grind, origin, or moisture content — measures differently. Re-verify every time a supplier changes. Don't wait for a problem to surface.
At 3–5% pre-tax margins, measurement error is a profitability problem. The operations that hold their margins aren't doing more sophisticated math. They're working from a better unit of measure before the math begins.
Why Volume-Based Ingredient Costs Produce Unreliable Blend Pricing
A spice blend priced from volume-based ingredient costs is built on a number that doesn't correspond to a fixed quantity of material. That's not a rounding issue. It's a structural problem in the costing model.
The density spread across common blend spices runs 2.5x from lightest to heaviest. Ground cloves pack at 0.35 teaspoons per gram. Dried dill measures at 0.90 teaspoons per gram. Apply a price-per-ounce to both using a volume-based cost calculation, and the cloves are being undercosted and the dill is being overcosted — in every batch, at every production volume, until the formula gets corrected.
What this produces in a costing model:
Blend margins that look acceptable on the sheet and compress in production
Cost-per-unit figures that drift as production volume increases
No reliable baseline for evaluating supplier changes or formula adjustments
The fix isn't a new pricing model. It's converting the ingredient measurements the pricing model is built on.
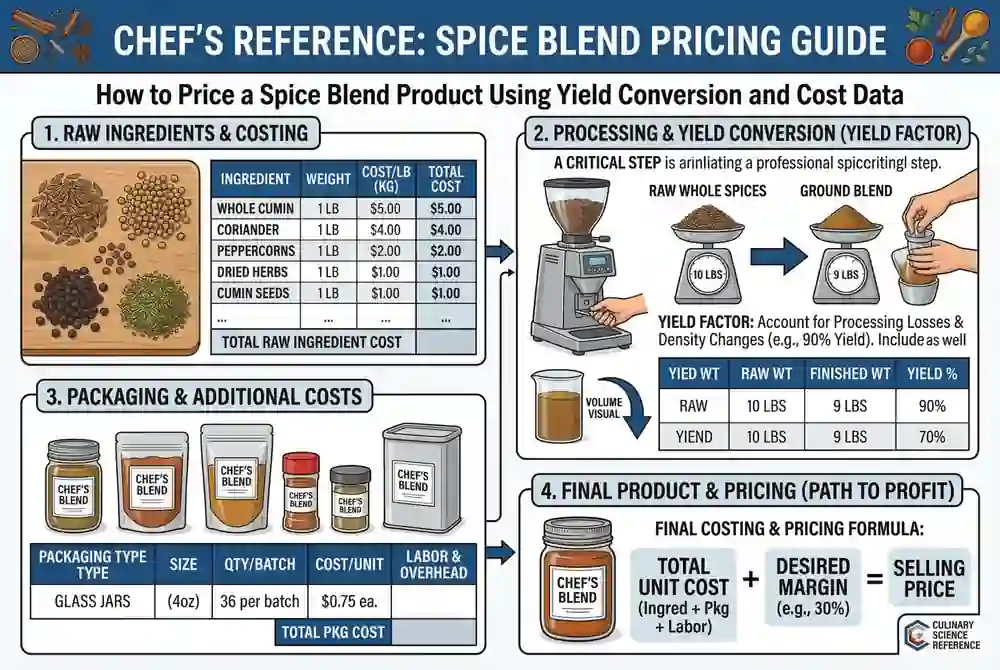
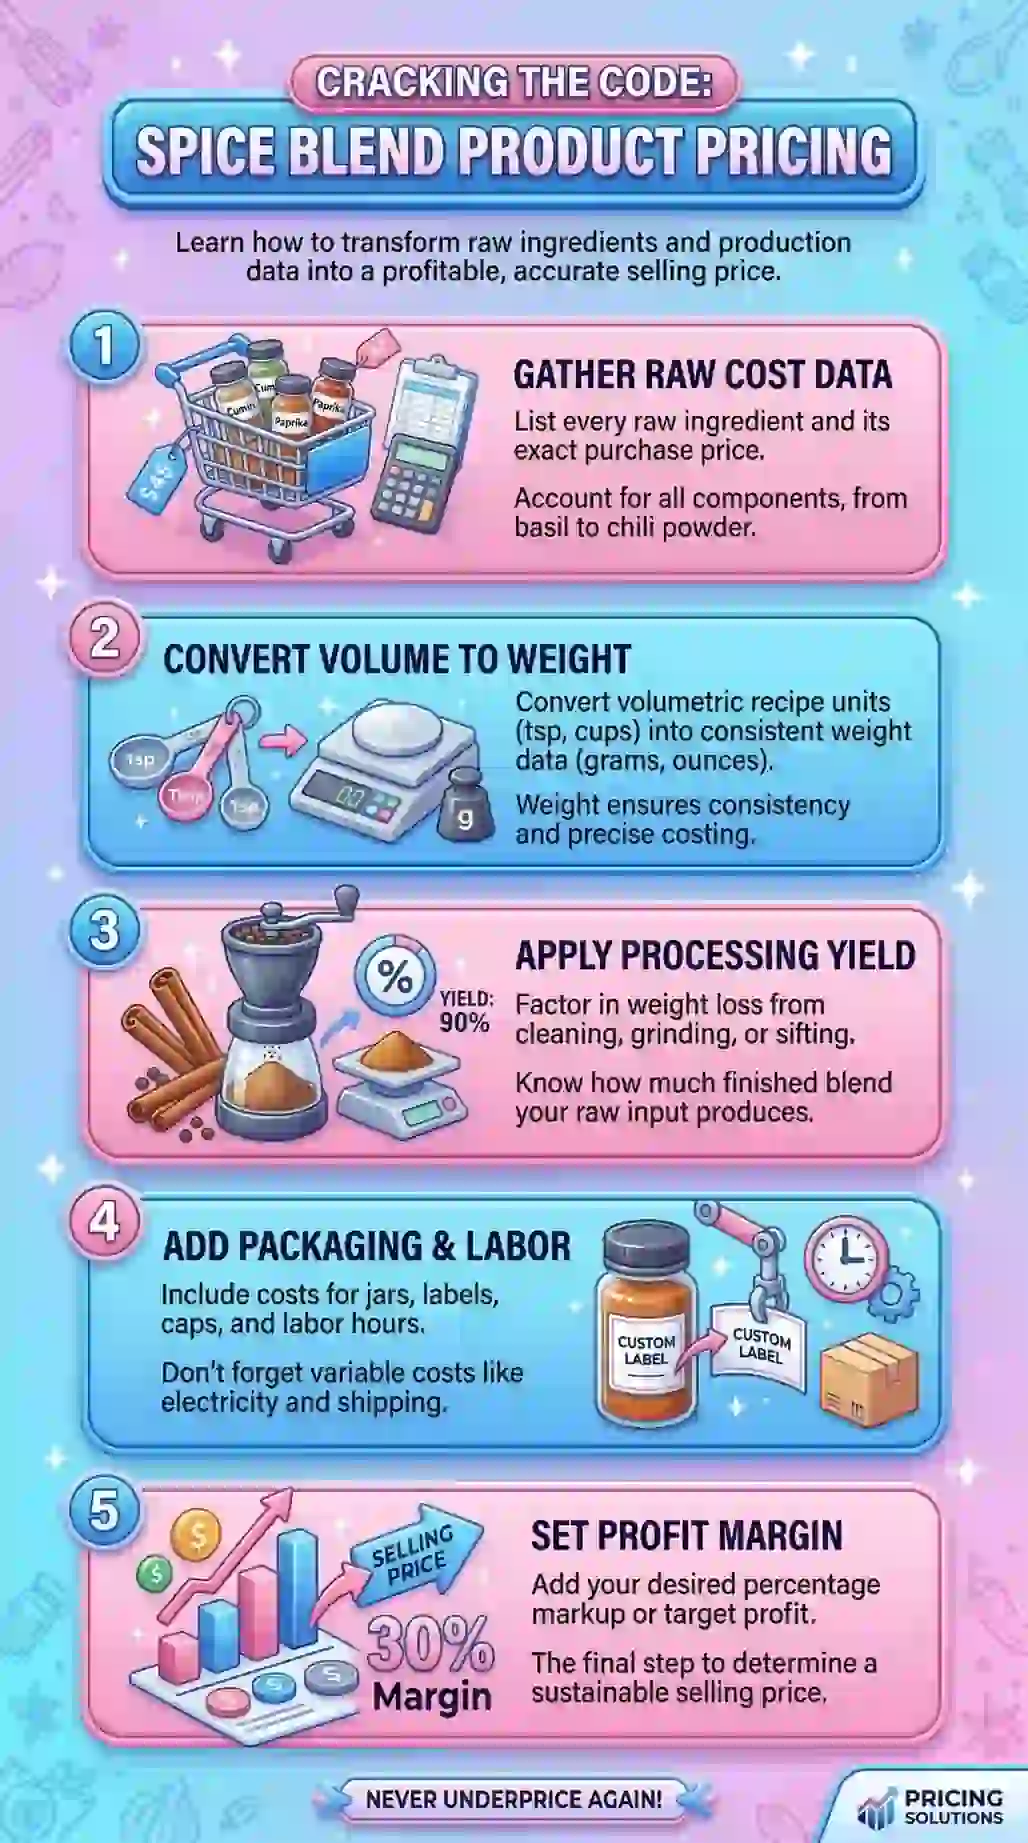
Step One — Convert Every Blend Component to Gram Weights Before Costing Anything
The costing process starts here. Not at the price-per-ounce. Not at the markup. At the gram weight of every component in the formula.
The conversion sequence:
List every spice in the blend formula with its volume measurement as specified in the development recipe
Pull density-specific yield data for each component — grams per teaspoon, referenced against a measured yield chart for that specific spice
Convert each volume measurement to grams: volume (tsp) ÷ yield (tsp/g) = gram weight per unit
Express the complete formula in gram weights per batch unit
Scale gram weights to production volume before any cost calculation begins
What this step eliminates: the directional errors that run through every volume-based cost calculation. A gram is a fixed unit. It doesn't change between suppliers, across shifts, or at production scale. Everything downstream of this step — cost-per-unit, margin calculation, pricing model — is only as reliable as the unit of measure it's built on.
Step Two — Calculate True Cost-Per-Gram for Each Blend Component
With gram weights established, the cost calculation becomes mechanical. The inputs needed for each component:
Invoice price per pound from current supplier
Conversion to cost-per-gram: price per pound ÷ 453.59 = cost per gram
Gram weight per batch unit (from Step One)
True ingredient cost per component: gram weight × cost-per-gram
Common errors we see at this stage:
Using price-per-ounce without converting to price-per-gram — introduces rounding error that compounds at scale
Pulling cost data from a previous supplier invoice without verifying current pricing
Applying a single cost-per-gram across multiple grind specifications of the same spice — coarse and fine grinds of the same spice from the same supplier can carry different price points
The output of this step: a true ingredient cost for every component in the blend, expressed in grams, built from current supplier pricing. This is the number the pricing model needs — not an estimate derived from volume measurements.
Step Three — Build the Blend's Total Ingredient Cost at Production Scale
With true cost-per-gram established for each component, the blend's total ingredient cost at any production volume becomes a straightforward calculation.
The formula:
Cost per batch unit = sum of (gram weight × cost-per-gram) for all components
Cost per production run = cost per batch unit × number of units per run
Cost per finished ounce = total ingredient cost ÷ finished product weight in ounces
What to build into this calculation that most blend costing sheets omit:
Yield loss factor — ground spices lose a measurable percentage of material to dust, container residue, and transfer loss during production. A 3–5% yield loss factor applied to total ingredient cost reflects actual production reality more accurately than a clean theoretical weight
Packaging weight offset — finished product weight should reflect net fill weight, not batch weight before packaging
Retest cost allocation — if the blend requires a quality check batch before full production, that ingredient cost belongs in the formula
Step Four — Apply Overhead, Labor, and Packaging Costs to the Ingredient Baseline
Ingredient cost is the foundation. The full cost-of-goods calculation adds the production inputs that don't show up in the formula but determine whether the margin is real.
Production cost components to layer onto the ingredient baseline:
Labor: time-per-batch × hourly production cost, allocated per unit
Packaging: per-unit cost of container, label, seal, and secondary packaging
Overhead allocation: facility, equipment depreciation, utilities, and quality control costs expressed as a per-unit figure
Minimum order adjustments: if a blend component requires a minimum purchase quantity that exceeds what the current production run consumes, the carrying cost of excess inventory belongs in the cost model
The number that results from this calculation — total cost of goods per finished unit — is the only reliable baseline for a pricing decision. Applying a markup to an ingredient cost estimate that was built on volume measurements produces a margin figure that the production run won't reproduce.
Step Five — Set Pricing Against a Cost Model That Accounts for Yield Variation
Most blend pricing models are built as if the formula is static. In practice, two variables change the cost calculation regularly enough that the pricing model needs to account for them from the start.
Variable one — supplier changes:
A new supplier, a different grind specification, or a new crop year shifts the gram weight that a volume measurement delivers
A 5% density shift in a high-cost component like ground cloves changes the blend's ingredient cost per unit by a measurable amount
Pricing built without a supplier change protocol will compress margin every time a sourcing decision gets made without re-verifying yield data
Variable two — component price fluctuations:
Spice commodity pricing moves with crop conditions, shipping costs, and currency shifts
A pricing model that doesn't include a component cost review trigger — tied to supplier invoice changes above a defined threshold — is absorbing those fluctuations silently into margin
What a pricing model that accounts for both variables looks like:
Ingredient cost baseline built from current gram weights and current supplier pricing
Cost-per-unit recalculation triggered by any supplier change or invoice price movement above 5%
Margin floor defined as a percentage of total cost of goods — not a fixed dollar markup
Price review schedule tied to production run frequency — quarterly minimum for high-volume blends
What Margin Targets Actually Require From a Measurement System
The margin a spice blend product needs to be viable is only achievable if the cost model it's priced from is built on accurate ingredient data. That's the connection most blend pricing conversations skip entirely.
What accurate ingredient data requires:
Gram weights, not volume measurements, as the formula baseline
Density-specific yield data, not universal conversion factors
Current supplier pricing, not historical invoice averages
Yield loss factors that reflect actual production conditions, not theoretical batch weights
We've seen blend products priced at what looked like a 40 percent gross margin produce 28 percent in production — because the ingredient cost calculation was built on volume measurements that understated the cost of the dense components and overstated the cost of the light ones. The margin compression wasn't a pricing decision. It was a measurement decision made before the pricing conversation ever started.
The pricing model is only as reliable as the cost data it's built on. The cost data is only as reliable as the unit of measure the formula was written in. Within a kitchen brigade system, where multiple roles rely on the same documented process, that unit needs to be grams — specific to the spice, verified against current supply, and documented before any markup calculation begins.
"We've reviewed costing sheets where the markup looked right, the math was clean, and the formula was still losing money at volume. The answer was always the same — ingredient costs built on volume measurements that had never been converted to gram weights. Dense components undercosted. Light components overcosted. A blend that shows 40 percent gross margin on a volume-based costing sheet can produce 28 percent in production. That's not a pricing problem. It's a measurement problem that was locked in before the pricing conversation ever started."
Essential Resources
We built this page around one problem: volume measurements produce unreliable results when spice density varies 2.5x across a single recipe. The resources below extend that foundation. Each one solves a different part of the problem — raw yield data, costing mechanics, bulk conversion references, and production-scale pricing tools.
1. Chefs Resources Dry Spice Yield Chart — The Density-Specific Data Behind This Page
This is where the conversion data on this page comes from. We measured gram weights and volume equivalents across 40+ individual spices and organized them by density category. Before you build any cost model, this is where you start. https://www.chefs-resources.com/culinary-conversions-calculators-and-capacities/dry-spice-yields/
2. USDA FoodData Central — Federal Weight Data for Cross-Referencing Your Spice Costs
When supplier spec sheets aren't available or you want to verify a gram weight against an independent source, this is the one to use. The federal database for food composition data includes ingredient-level weight measurements for hundreds of spices. https://fdc.nal.usda.gov/
3. Recipe Profit AI Spice Conversion Chart — A Fast Reference for Translating Volume Specs to Ounce-Based Costs
We've seen kitchens spend more time on unit conversion math than on actual costing work. This quick-reference table handles the teaspoon-to-ounce translation and walks through a cost calculation method you can apply to any recipe. https://recipeprofit.com/spice-conversion-teaspoons-to-ounces/
4. meez Chef's Guide to Accurate Recipe Costing — AP Cost, EP Cost, and the Q-Factor Explained for Working Kitchens
If you're building a blend pricing model from standardized recipes, this is the most practical framework we've found. It covers as-purchased vs. edible portion cost, Q-factor calculation for small ingredients like spices, and how to link sub-recipe costs so your numbers don't drift when one component changes. https://www.getmeez.com/blog/a-chefs-guide-to-accurate-recipe-costing
5. Shamrock Foods Dry Spice Conversions — A Commercial Foodservice Reference for Volume-to-Weight Verification
We use this as a secondary check when a spice conversion looks off or when we're onboarding a new supplier whose product measures differently than expected. It covers common commercial spices at foodservice volumes — useful context that goes beyond small-batch measurements. https://www.shamrockfoodservice.com/wp-content/uploads/2018/05/DrySpiceConversions.pdf
6. Allied Kenco Spice Conversions Chart — Production-Scale Conversion Data From Commercial Food Manufacturing
This one comes from meat processing and commercial food production environments, which means the quantities and formats are relevant to anyone working at batch scale. If your production formulas run in pounds rather than tablespoons, this is the reference to have on hand. https://www.alliedkenco.com/pdf/Spice%20Conversions.pdf
7. Galley Solutions Definitive Food Costing Guide — The Full Cost-to-Price Workflow When Spice Costs Are One Variable Among Many
Accurate spice conversion solves one part of a larger costing problem. This guide covers the rest — cost per unit, trim yield, margin calculation, and recipe-level profitability analysis. We recommend it for anyone building a pricing model that needs to hold as ingredient costs shift. https://www.galleysolutions.com/blog/food-costing-formula
These essential resources provide verified spice yield data, conversion tools, and costing frameworks that help kitchens maintain accurate ingredient calculations and consistent production formulas—an approach that reflects the same careful sourcing and measurement practices seen in the benefits of buying organic, where ingredient quality, transparency, and precise handling all contribute to better results.
Supporting Statistics
We built this chart after years of watching kitchens lose money in ways that never showed up cleanly on a P&L. The data below didn't surprise us. It confirmed what we'd already watched happen across hundreds of kitchens.
Food Costs Represent 32% of Sales — Pre-Tax Margins Run 3–5%
The numbers:
Food and beverage costs: median 32% of sales across 900+ restaurant operators
Pre-tax margins for the average restaurant: 3–5%
Full-service operators under $2M in annual sales: median pre-tax income of 1.1%
Our perspective: We've sat across from operators convinced their food cost problem was a purchasing problem. More often, it traced back to volume-based ingredient specs that should have been written in weight. Consider the math:
One cook measures a "heaping teaspoon" differently than another
That happens across 300 covers a day
Multiplied over 12 months, the error isn't small
At a 3–5% pre-tax margin, recurring invisible measurement error has nowhere to hide. The operations that hold their margins eliminated that variable before it had a chance to compound.
Source: National Restaurant Association — Restaurant Operations Data Abstract 2025 https://restaurant.org/research-and-media/research/restaurant-economic-insights/analysis-commentary/restaurant-operators-kept-food-cost-ratios-in-check-in-2024/
Nearly 70% of Foodservice Surplus Food Comes From Plate Waste
The numbers:
12.5 million tons of surplus food generated by restaurants and foodservice in 2024
Nearly 70% of that total: plate waste — food served but not eaten
85%+ of all foodservice surplus: sent to landfill or incineration
Full-service restaurants: 43%+ of total sector surplus
Our perspective: Most kitchens chase waste reduction through trim, spoilage, and over-production. Those are real problems. But inconsistent seasoning is a plate waste driver that rarely gets named for what it is. We've watched the same dish go from consistent seller to complaint magnet between one week and the next with:
No change to the recipe on paper
A meaningful shift in how the spice blend was measured in practice
That's not a kitchen discipline problem. It's a measurement unit problem. Volume measurements shift with who's scooping and how long the container has been sitting, which is exactly why strong kitchen management systems move toward weight-based measurements to keep results consistent. The plate waste follows.
Source: ReFED — Restaurants and Foodservice Sector Analysis, 2024 https://refed.org/stakeholders/restaurants-and-foodservice/
31% of the U.S. Food Supply Goes Uneaten — 133 Billion Pounds Annually
The numbers:
31% of food at retail and consumer levels goes uneaten — USDA Economic Research Service
Equivalent to 133 billion pounds and $161 billion worth of food annually
USDA/EPA joint goal: 50% reduction in food loss and waste by 2030
USDA's identified highest-leverage intervention: upstream process improvement before waste occurs
Our perspective: Every waste reduction framework we've seen focuses on the back end — donations, composting, markdowns. Those matter. But USDA's own framing points upstream: fix the process before the food is made. That's exactly where spice measurement lives. We've seen kitchens implement full waste tracking programs without ever addressing the fact that their standardized recipes were still written in teaspoons. Converting spice specs from volume to gram weight:
Costs nothing to implement
Requires no ongoing infrastructure
Holds indefinitely once documented
It belongs at the front of any waste reduction conversation — not as an afterthought.
Source: USDA — Food Loss and Waste FAQs / Economic Research Service https://www.usda.gov/about-food/food-safety/food-loss-and-waste/food-waste-faqs
Final Thought & Opinion
We measured spices the way everyone else did for years — by volume, by eye, by habit. It wasn't until we tracked recipe drift across high-volume production that we understood the problem wasn't discipline or technique. It was the unit of measure itself.
What this page covers:
Why volume measurements fail when spice density varies 2.5x across a single recipe
How to convert volume specs to gram weights before costing or scaling
Which spices create the highest measurement error risk at production scale
How supplier changes and grind differences compound errors over time
What a weight-based spice specification system looks like in practice
Our take:
The universal half-teaspoon-per-gram conversion works often enough that kitchens keep using it. That's exactly what makes it dangerous. It's wrong in a specific, directional way:
Ground cloves will cost you more than your sheet says
Dried dill will cost you less
Applied across a full blend, those errors don't cancel out — they stack
We've been called in to troubleshoot costing problems operators had been chasing for months. New supplier. Portion retraining. Menu price adjustments. The underlying issue, more often than expected: a spice blend priced on volume measurements nobody had ever converted to weight. The math looked clean. The margins didn't hold.
The bottom line:
A teaspoon tells you how much space a spice occupies. A gram weight tells you how much spice you actually have. Those are different numbers — and the gap between them is where recipe consistency and food cost accuracy either hold or fall apart.
Three changes that pay forward indefinitely:
Convert every spice spec in your standardized recipes from volume to gram weight — once
Build gram weights into your costing sheets as the primary unit
Re-verify when suppliers change — the same spice from a different source measures differently
Kitchens operating at 3–5% pre-tax margins cannot absorb recurring, invisible measurement errors. The fix is structural, not incremental. It starts before the math, at the unit of measure you build everything else on.
FAQ on Spice Yield Conversion Chart
Q: What is a spice yield conversion chart and how is it different from a standard conversion table?
A: A standard conversion table gives you one number for every spice. A yield chart gives you the right number for each spice.
Why it matters:
Spice density varies 2.5x between lightest and heaviest common spices
Universal factor of 0.5 tsp/g is accurate for some spices, meaningfully wrong for others
Ground cloves convert at 0.35 tsp/g. Dried dill converts at 0.90 tsp/g
After measuring 40+ spices individually, we found a single conversion factor isn't a costing tool — it's a source of compounding error dressed up as one.
Q: Why do different spices measure so differently by volume when the gram weight is the same?
A: Density — and it's more variable than most cooks expect.
Key variables that affect how a spice fills a measuring spoon:
Particle size
Grind coarseness
Moisture content
Physical structure of the plant material
We've watched cooks measure what they believed was the same amount of two different spices and end up nearly three times apart in actual weight. That's not a technical error. That's physics working against a measurement system not designed for variable-density materials.
Q: How do I use a spice yield conversion chart to cost a recipe or spice blend accurately?
A: The sequence matters more than the math. Do this before any costing math begins:
List every spice component with its volume measurement as written
Pull the density-specific yield factor for each individual spice
Convert each volume to grams using that spice's actual yield data
Calculate cost per gram from current supplier invoice pricing
Multiply grams used by cost per gram for each component
Sum all components for total blend cost
Never run pricing math against volume measurements directly. Apply scaling factors or markup only after conversion is complete.
Q: Which spices create the biggest costing errors when measured by volume instead of weight?
A: The ones furthest from the universal 0.5 tsp/g assumption — and the ones that appear most often in high-cost blends.
Systematically undercosted — denser than assumed: ground cloves, mustard seed, celery seed, fenugreek, garlic powder, turmeric
Systematically overcosted — lighter than assumed: dried dill, dried parsley, dried chervil, dried mint, dried basil
Closest to universal factor — lowest error risk: paprika, cumin, chili powder, coriander, cardamom
Any blend combining dense and light spices carries compounding errors in both directions simultaneously. That's how a costing sheet can look mathematically clean and still be wrong on every line.
Q: Does spice yield data change when I switch suppliers or buy a different grind?
A: Every time — and it's the variable kitchens underestimate most consistently.
What changes between suppliers:
Grind coarseness — finer grinds pack more densely, coarser grinds pack less
Moisture content
Regional origin
Processing differences
We've tracked flavor and costing inconsistencies attributed to cook error or recipe drift — the actual cause was a supplier change nobody flagged as relevant to their yield data.
When your supplier changes:
Your conversion data is unverified until you re-measure
Build re-verification into your process at every supplier transition
Don't wait for a problem to tell you it needed to happen


