Dry spice yields are one of the least-tracked numbers in food costing. Most operators write spices off as cheap — a few dollars a jar, nothing next to the cost of tenderloin or a day’s produce order. Per plate, that math holds. Across a week of covers, across every dish that leans on the same handful of workhorse spices, it doesn’t.
This piece is for operators, chefs, and F&B managers who want their menu prices to reflect what their dishes actually cost to plate. We’ll walk through what dry spice yields really measure, how to build them into a pricing formula, where yield quietly disappears in a working kitchen, and how to correct the numbers already baked into a live menu.
A note on terminology first. A spice is a dried aromatic plant product, such as a seed, root, bark, or fruit, used for flavor rather than nutrition. Drying is what makes the category shelf-stable, and it’s also why yields rarely come out clean. Moisture keeps moving out of the product after purchase. Chaff, stems, and sifting waste take more. Kitchen habits finish the job.
TL;DR Quick Answers
dry spice yields
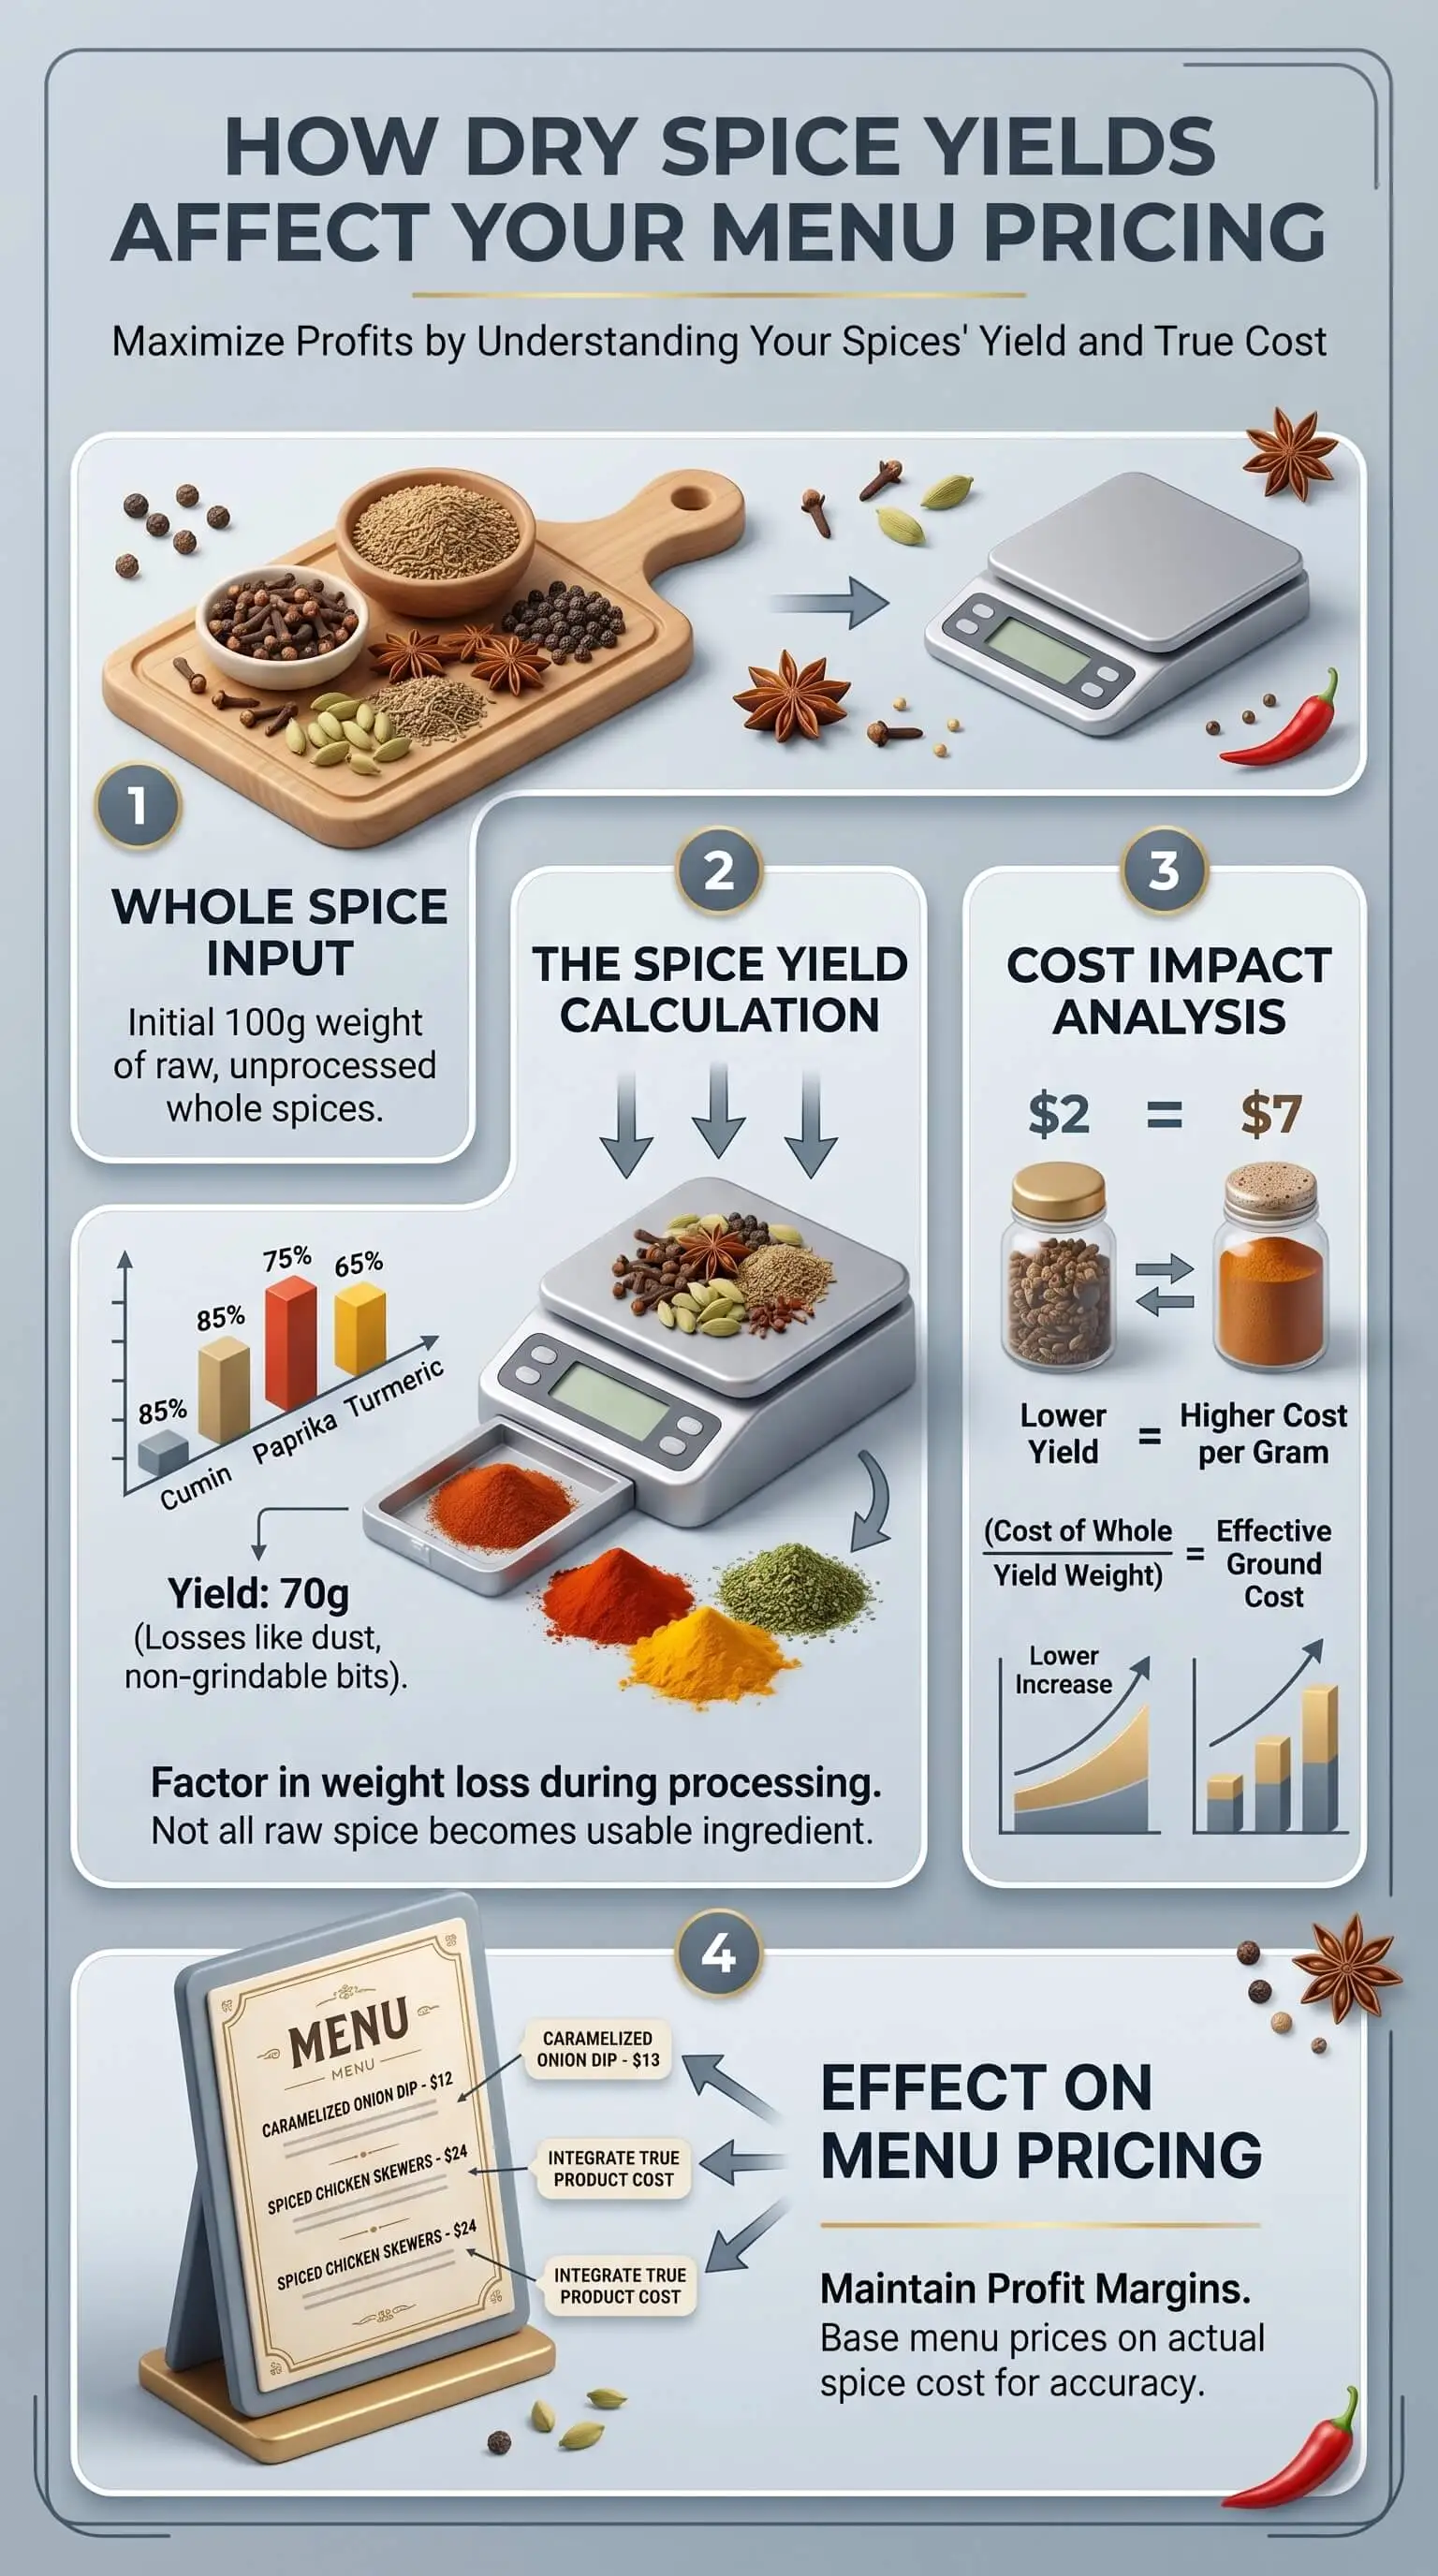
Dry spice yields are the percentage of purchased weight that ends up actually used in cooking, after moisture loss, sifting, stems and chaff, and prep waste take their cut. Most working kitchens see real yields between 75% and 90%, with variation by spice type and storage conditions.
Why it matters for menu pricing:
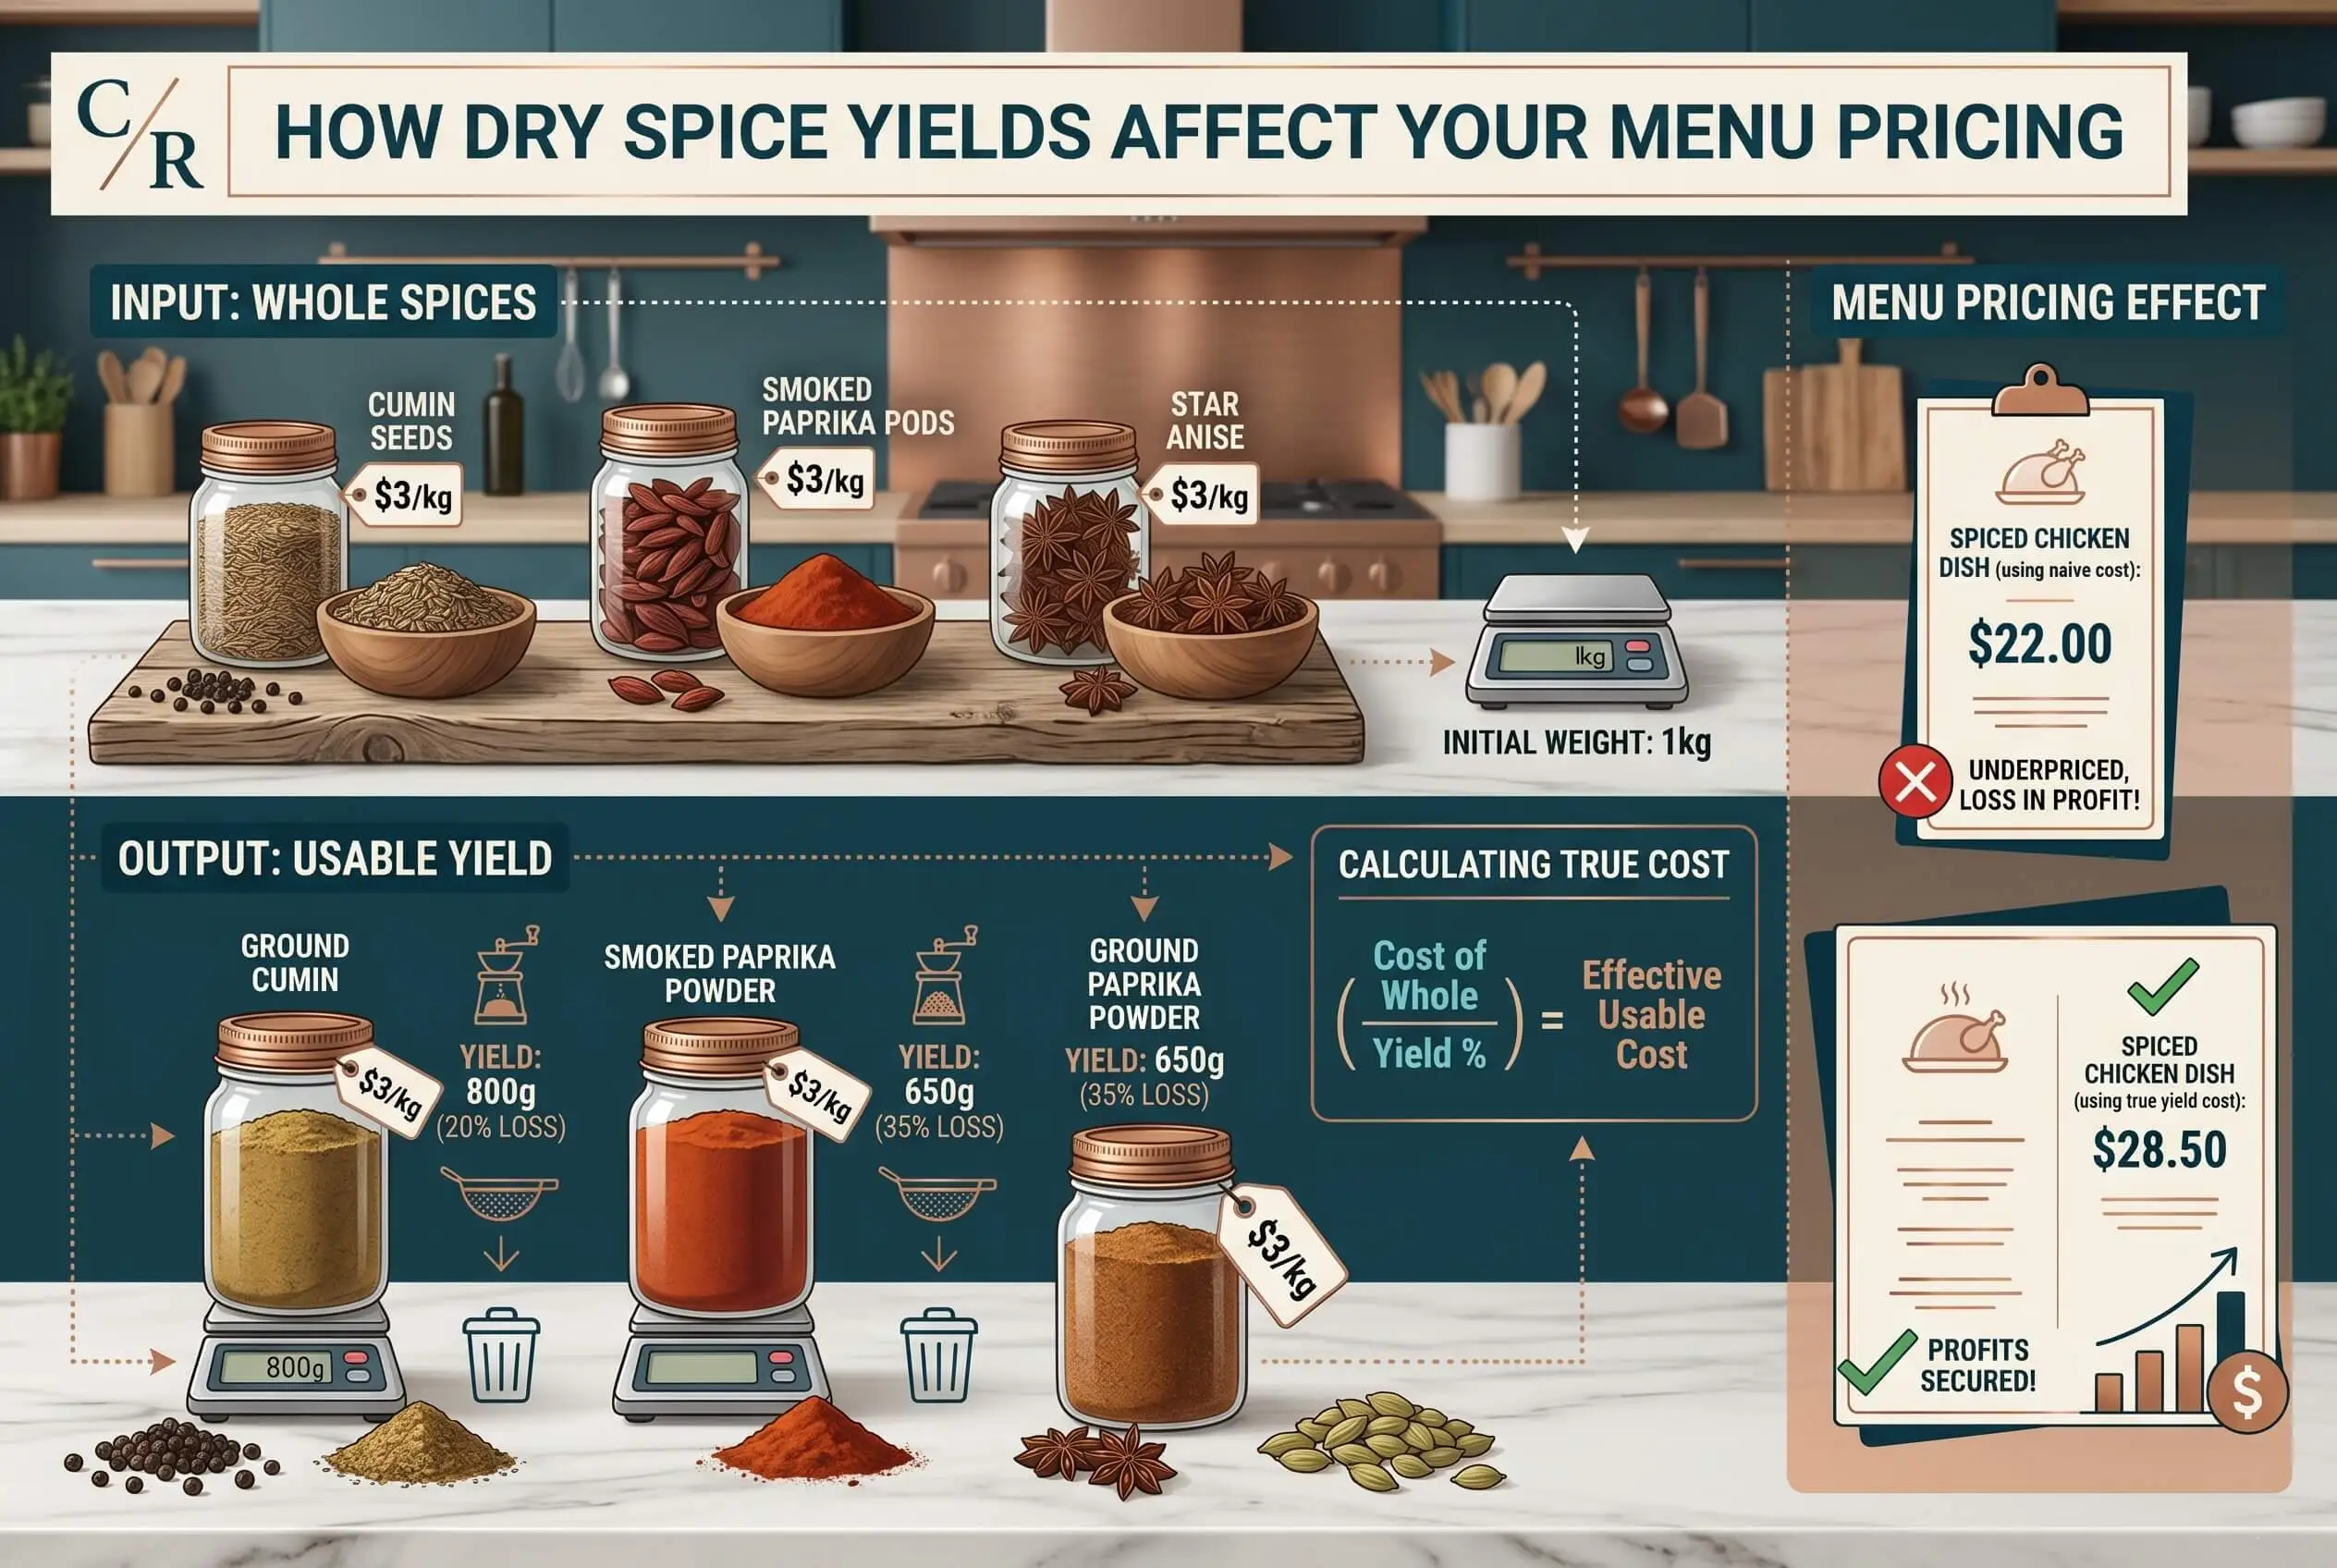
Invoice weight overstates a usable product, so true ingredient cost is always higher than the price tag suggests.
The yield-adjusted pricing formula is: Menu Price = Yield-Adjusted Ingredient Cost ÷ Target Food Cost %.
The four biggest drains on yield are moisture loss, stale stock, sifting waste, and prep spillage.
The practical first step is a one-week yield test on your ten highest-use spices, then re-pricing any dish sitting outside your food cost target.
Top Takeaways
• Dry spice yields rarely match purchased weight. Expect 75%–90% in most working kitchens, with variation by spice type and storage conditions.
• The yield-to-price formula is straightforward: yield-adjusted ingredient cost divided by target food cost percentage gives you a defensible menu price.
• Moisture loss, sifting waste, stale stock, and prep spillage are the four quiet drains on usable spice weight. None of them show up on an invoice.
• Audit your top ten highest-use spices first. Those are the ones moving plates cost by meaningful amounts.
• Supplier spec sheets are a starting benchmark, not a finishing number. Validate yields against your own inventory before you trust them for pricing.
• Rebuild recipe costing on yield-adjusted numbers, then re-price any dish sitting outside your food cost target.
• Set a quarterly cadence for re-measuring yields. Suppliers change, formats change, yields drift.
Dry spice yield is the ratio of usable product to what you bought. Bring in a pound of dried oregano leaves, pull the stems, sift out the old-stock jars, skip the bottom-of-the-jar dust, and you’ll often land around 13 ounces of useful flavor. Your real yield is 81%. The missing 19% is money that left the kitchen before it ever made it onto a plate.
Chefs already understand this gap when it comes to proteins and produce. Nobody prices a ribeye on its raw, untrimmed weight. Spices get priced that way constantly, though, because the per-jar cost looks too small to matter. It isn’t. A kitchen that burns through three pounds of ground black pepper a week at an 85% real yield is throwing away more than 23 pounds of pepper a year in unaccounted loss. On your higher-volume spices, the numbers climb faster.
The yield-to-price formula. The core math is simple:
Menu Price = Yield-Adjusted Ingredient Cost ÷ Target Food Cost %
The step most operators miss is the yield adjustment. A $12-per-pound spice at 80% yield has a true per-usable-pound cost of $15, not $12. Feed that corrected number into your food cost formula instead of the invoice price, and your menu price moves with it. Before you measure your own numbers, a professional dry spice yields reference gives typical conversions for ground and whole spices. A useful first pass before you calibrate to your own operation.
Where yield loss hides. The biggest culprits aren’t the obvious ones. Moisture loss in storage, especially in kitchens with poor humidity control or open bulk bins, accounts for more day-to-day yield erosion than most cooks realize. Sifting out caked, crystallized, or off-color products adds more. Spillage during prep, especially when line cooks are scooping from large containers during a busy service, quietly removes a few more percent. Then there’s the silent one: stale stock. A spice that’s lost half its aromatic intensity still weighs the same on a scale, but you’ve got to use twice as much of it to hit the same flavor. That yield loss is measured in a different way.
Applying yield data to a live menu. The practical approach is narrow and fast. Pick your top ten highest-use spices. Run a one-week yield test on each by weighing what comes in and what actually gets used. Rebuild your recipe costing sheets with the corrected numbers. Re-price any dish where the updated cost pushes your food cost percentage outside your target range. Most operators find their real yields land between 75% and 90%, with heavy variation by spice type. That’s enough of a swing to shift plate cost by a dime or two on dishes where spices carry weight. Across thousands of covers, that’s the difference between hitting margin and missing it.
"The first time I ran a yield audit in my own kitchen, I expected a couple of surprises. What I got was a reckoning. I looked at our three heaviest-use spices: ground black pepper, paprika, and cumin. Each was running lower than I would have sworn. The pepper came in at 84%. The cumin was worse, because we were sifting out clumps we didn’t realize we were sifting out. I had been costing those three on invoice weight for eight years. When I rebuilt a handful of signature dishes with the real yields, two of them were sitting almost four points above the food cost percentage my spreadsheet was showing. A four-point miss at that scale is the difference between a month you’re happy with and one you’re not. What I tell operators who aren’t sold on any of this: don’t trust me, don’t trust the spec sheet, don’t trust your supplier. Weigh it going in. Use it. Weigh what’s left. The number you get back is the only one that counts."
7 Essential Resources
Building real spice yield data into a menu pricing workflow takes more than one reference. These are the sources I keep close:
• Chef's Resources — Dry Spice Yields: A working conversion chart for ground and whole spices with volume-to-weight figures. Useful as a starting benchmark before you run your own measurements.
• American Spice Trade Association (ASTA): The long-standing U.S. trade body, with technical standards, food safety guidance, and sourcing resources used across the industry since 1907.
• Wikipedia — Spice: A general-purpose overview of what qualifies as a spice, how the category is produced, and where the global supply comes from.
• McCormick — Shelf Life FAQ: Recommended shelf-life ranges for ground spices, whole spices, leafy herbs, and blends, published directly by one of the largest spice manufacturers in the world.
• USDA — Food Loss and Waste: The federal overview of food loss across the supply chain, with definitions that explicitly include moisture loss and natural shrinkage, which is exactly what shows up in spice yields.
• National Restaurant Association — Menu Price Tracking: Monthly menu pricing data, inflation context, and operator-side research on how menu prices are moving across full-service and limited-service segments.
• Allied Kenco — Spice Conversions Reference: A printable ounces-to-tablespoons-to-teaspoons reference for dozens of common spices. Handy for back-of-house calibration work.
3 Statistics
• Food cost usually runs 28%–35% of sales in well-managed restaurants. The National Restaurant Association’s 2025 Restaurant Operations Data Abstract put the 2024 median food and non-alcohol beverage cost at 32.4% of sales for limited-service operators. Yield-adjusted spice costing moves dishes toward the healthy end of that range instead of letting them drift past it. (National Restaurant Association)
• U.S. menu prices rose roughly 3.8% year-over-year as of March 2026. Per the NRA’s menu price tracking, full-service menu prices have averaged 0.4% growth per month over the past year. Operators who re-cost menus without accounting for yield loss miss a chunk of the headroom those price increases create. (National Restaurant Association)
• Restaurants waste an estimated 4%–10% of the food they buy before it ever reaches a customer. That figure, drawn from research cited by FoodPrint and aligned with USDA food-loss definitions, rolls in moisture loss, shrinkage, and handling waste, the same forces that pull dry spice yields below purchase weight. (FoodPrint — Food Waste)
Final Thoughts and Opinion
Yield is the kind of line that looks invisible until someone points it out. Then you can’t unsee it. Restaurants that treat spices as immaterial because they’re cheap are making a scale error, because each individual use is small, but the uses stack up across every ticket, every night, every week of service. The profitable kitchens I’ve watched operate over the years share one habit: they measure what they use, and they price based on what’s actually getting plated.
The case for working dry spice yields into menu pricing isn’t about chasing pennies. It’s about closing a blind spot the industry has collectively tolerated for decades. Once the real numbers are in front of you, the pricing decisions that follow aren’t complicated. You raise the prices that need raising, you swap out the spices where the yield math doesn’t work, and you set a cadence for re-checking the numbers as suppliers and inventory shift. That’s it. The hard part is sitting down to do it the first time.
I’ll also push back on the line that "our restaurant is too small for this to matter." Small operations often feel the hit from unaccounted spice loss more than large ones, especially those that value sustainable agriculture and careful sourcing. Thinner margin cushion. Higher concentration of sales on a handful of signature dishes. If anything, a ten-seat neighborhood spot has more to gain from getting this right than a chain does. The chain spreads the error across thousands of units. The independent operator eats it alone.
Frequently Asked Questions
What exactly is a dry spice yield?
Dry spice yield is the percentage of as-purchased weight that ends up actually used in dishes, after moisture loss, sifting, stem and chaff removal, and prep waste. A spice purchased at one pound that produces 13 ounces of usable product has a yield of about 81%.
Why don't dry spices yields 100%?
Dried spices keep losing moisture after harvest, especially once a container is opened. Leafy spices carry stems and chaff that aren’t usable. Ground spices develop clumps that get sifted out. Grinding and prep steps take small amounts off with every pass. All of that sits between the invoice weight and the amount that actually flavors a dish.
How often should I re-measure spice yields in my kitchen?
A quarterly cadence is a reasonable starting point. Re-measure sooner if a supplier or spice format changes, if your storage environment shifts, or if your recipe costing starts showing variance against actual food cost percentage.
Do dry spice yields really matter for a small restaurant?
Yes, often more than at larger operations. Small restaurants tend to have thinner margin cushions and higher concentration of sales on a handful of signature dishes. Unaccounted yield loss on a frequently used spice compound faster as a share of total sales.
How do dry spice yields compare to fresh herb yields?
Dry spice yields are generally higher and more stable than fresh herb yields. Fresh herbs lose substantial weight during stem removal and trimming, often 30%–50% of AP weight. Dry spices typically retain more of their purchased weight because drying has already pulled the moisture out, though ongoing moisture loss and sifting still erode yield.
What causes the most yield loss in dry spices?
In most kitchens, the biggest cause is stale stock. A spice that’s lost its aromatic potency forces cooks to use more of it to hit the same flavor target. That yield loss is measured in a different way. Poor-storage moisture loss is a close second.
CTA
If you’re working through a pricing review, the next useful piece on this site is the breakdown of how to price a spice blend product using yield conversion and cost data. Same math, different application. For portion and yield work on proteins, the hake portion planning piece runs the same AP-to-EP framework on a different ingredient class.
Bookmark this page, share it with the people on your team who touch recipe costing, and come back after you’ve run a yield test of your own. The numbers you find will tell you more about your menu than any supplier spec sheet ever could.


